
“James really understood the problem we were trying to solve, and this was clearly reflected in the high-quality work he delivered. James built a data visualisation for us which transformed a complex data set into a simple tool which is now used business-wide.”
Alexandra Joseph
All4
Head of Creative Innovation at Channel4: Alexandra Joseph
Data Scientist: Thomas Nuttall
Project Manager: Helen Otter
HAVAS
Senior Developer: Wayne Davis
Head of Development: Anton McCoy
Visual Design: Rob Stimpson
Head of UX: James Sinclair
Background
The All4 team developed a taste segmentation based on the program preferences of 3.4 million viewers. This data was updated weekly and shared as a slide deck with Channel 4 (C4) editors, who used it to make program recommendations for All4 users. The All4 team believed that an interactive data visualization would better support the editors’ work. The C4 data science team attempted this, but the results did not meet the editors’ expectations.
Challenge
- Understand the complex dataset and All4 team’s vision
- Transform the data into a user-friendly tool
- Engage with hesitant C4 editors to gain their trust
- Ensure editors feel comfortable with the process and confident in the product
Approach
- Conduct a workshop to review existing visualization and gather All4’s requirements
- Sketch out a design based on requirements to further investigate All4’s needs
- Render the model as static wireframes to engage editors and understand their work processes
- Reimagine data in a way that editors can recognize and use
- Begin visual design with Rob and build a functioning prototype incorporating All4’s data
- Use the prototype as the primary mechanism for generating and testing ideas with editors
- Develop new features and functions that address editors’ needs
- Use the prototype to inform data formatting and processing for the technical solution
Outcome
- Created an application displaying All4 viewing trends in near-real time
- Provided unprecedented access to otherwise inaccessible data
- Delivered the requested product and helped editors develop their ideas
- Demonstrated new ways to explore the data, leading to a better product
- Achieved success with the tool, leading to adoption by the wider business
Prototype
proto_overview
proto_seg
proto_over

Visual Design
Using All4’s design guide
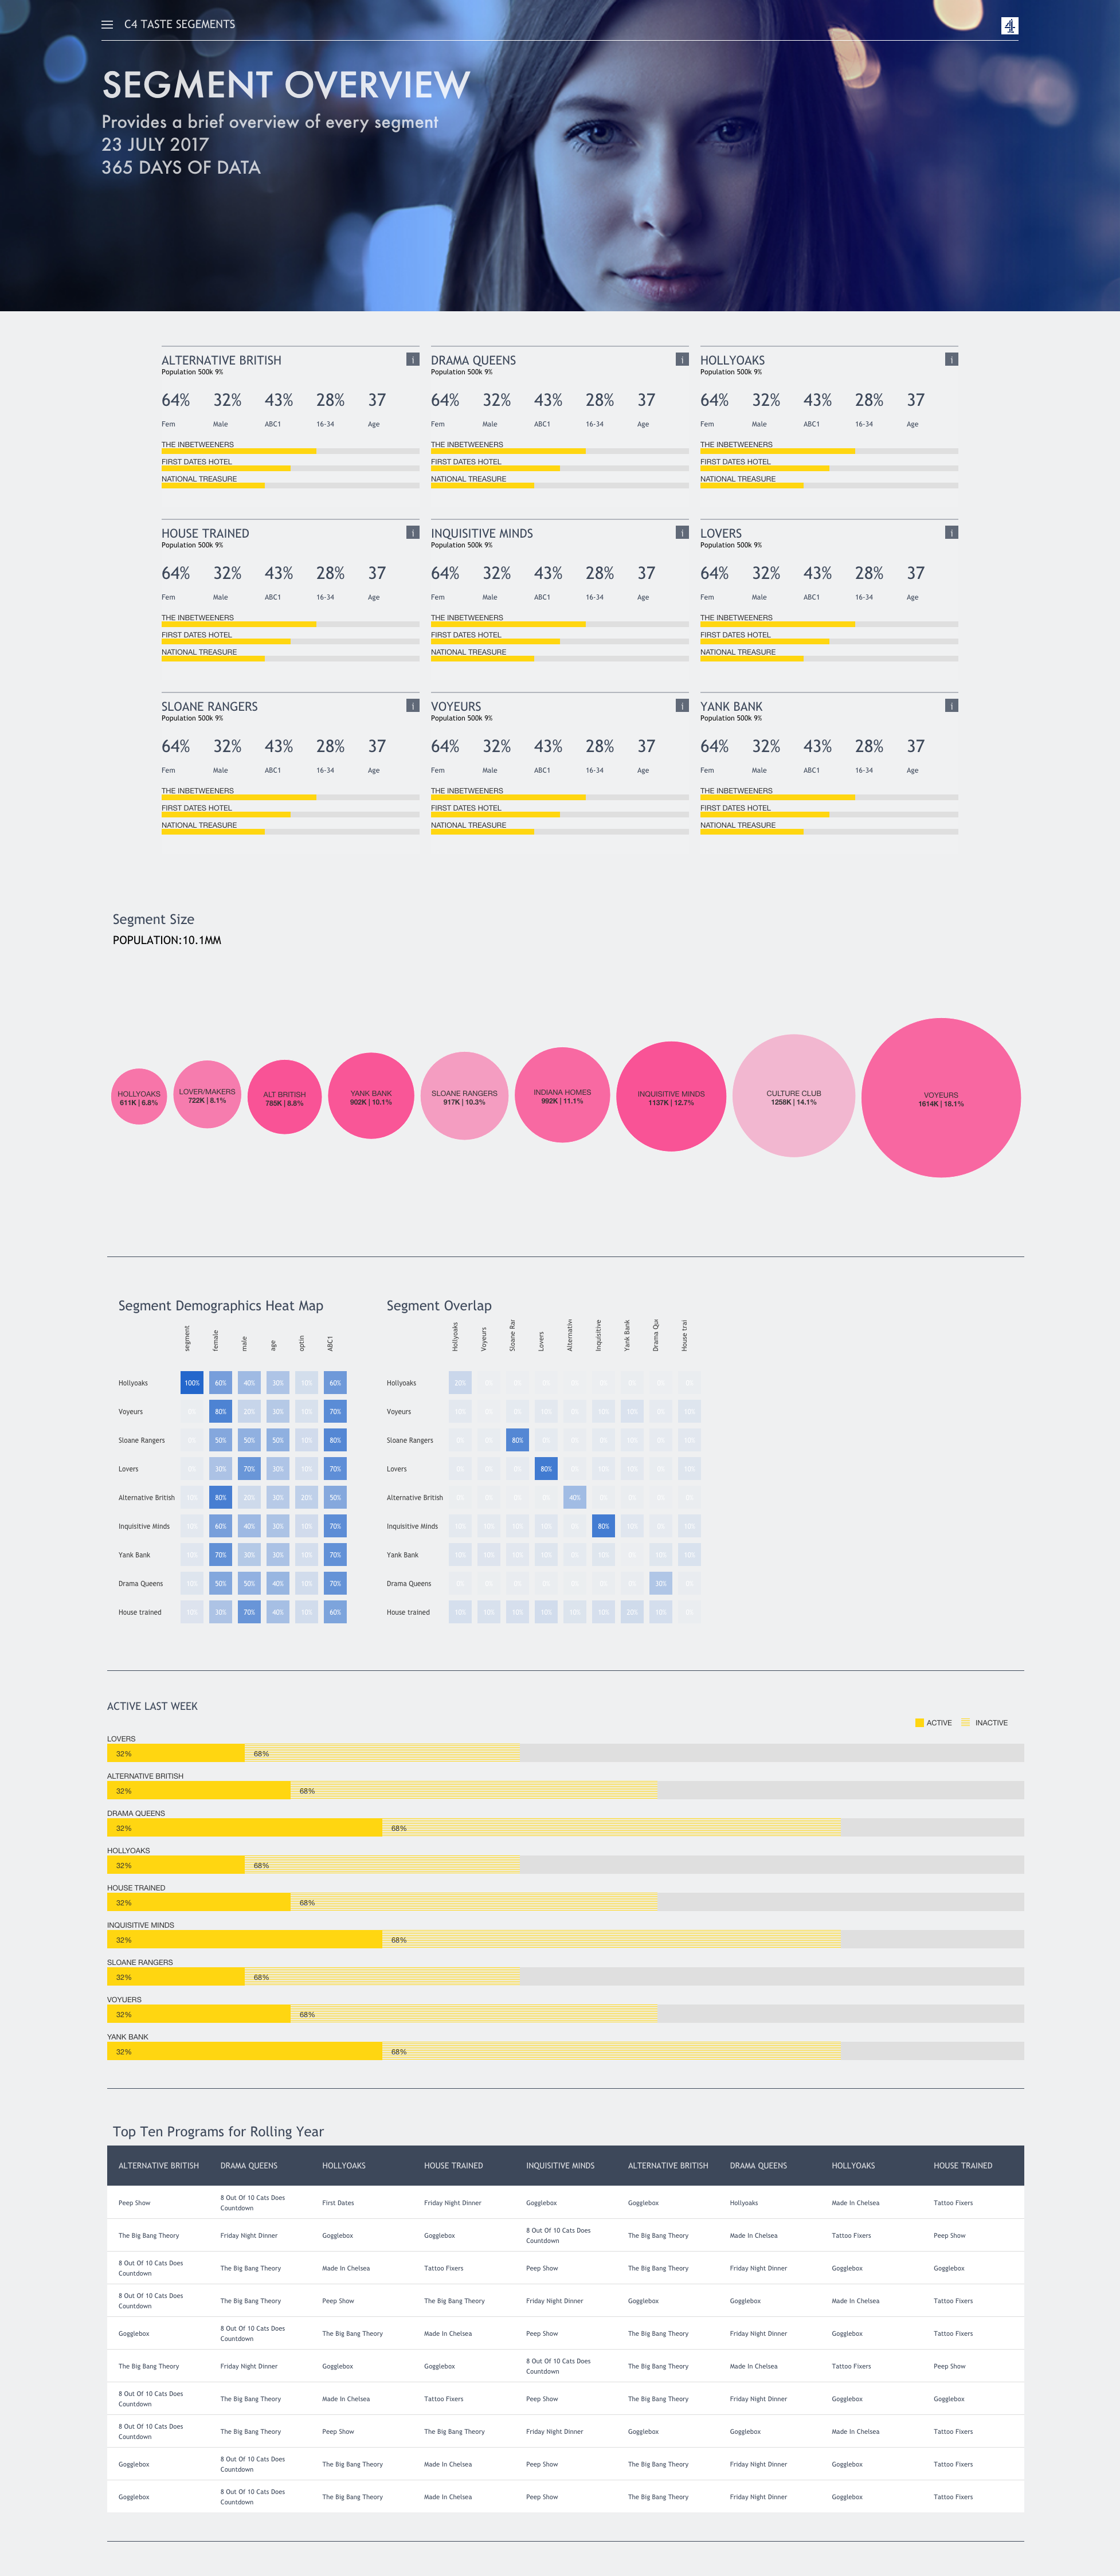
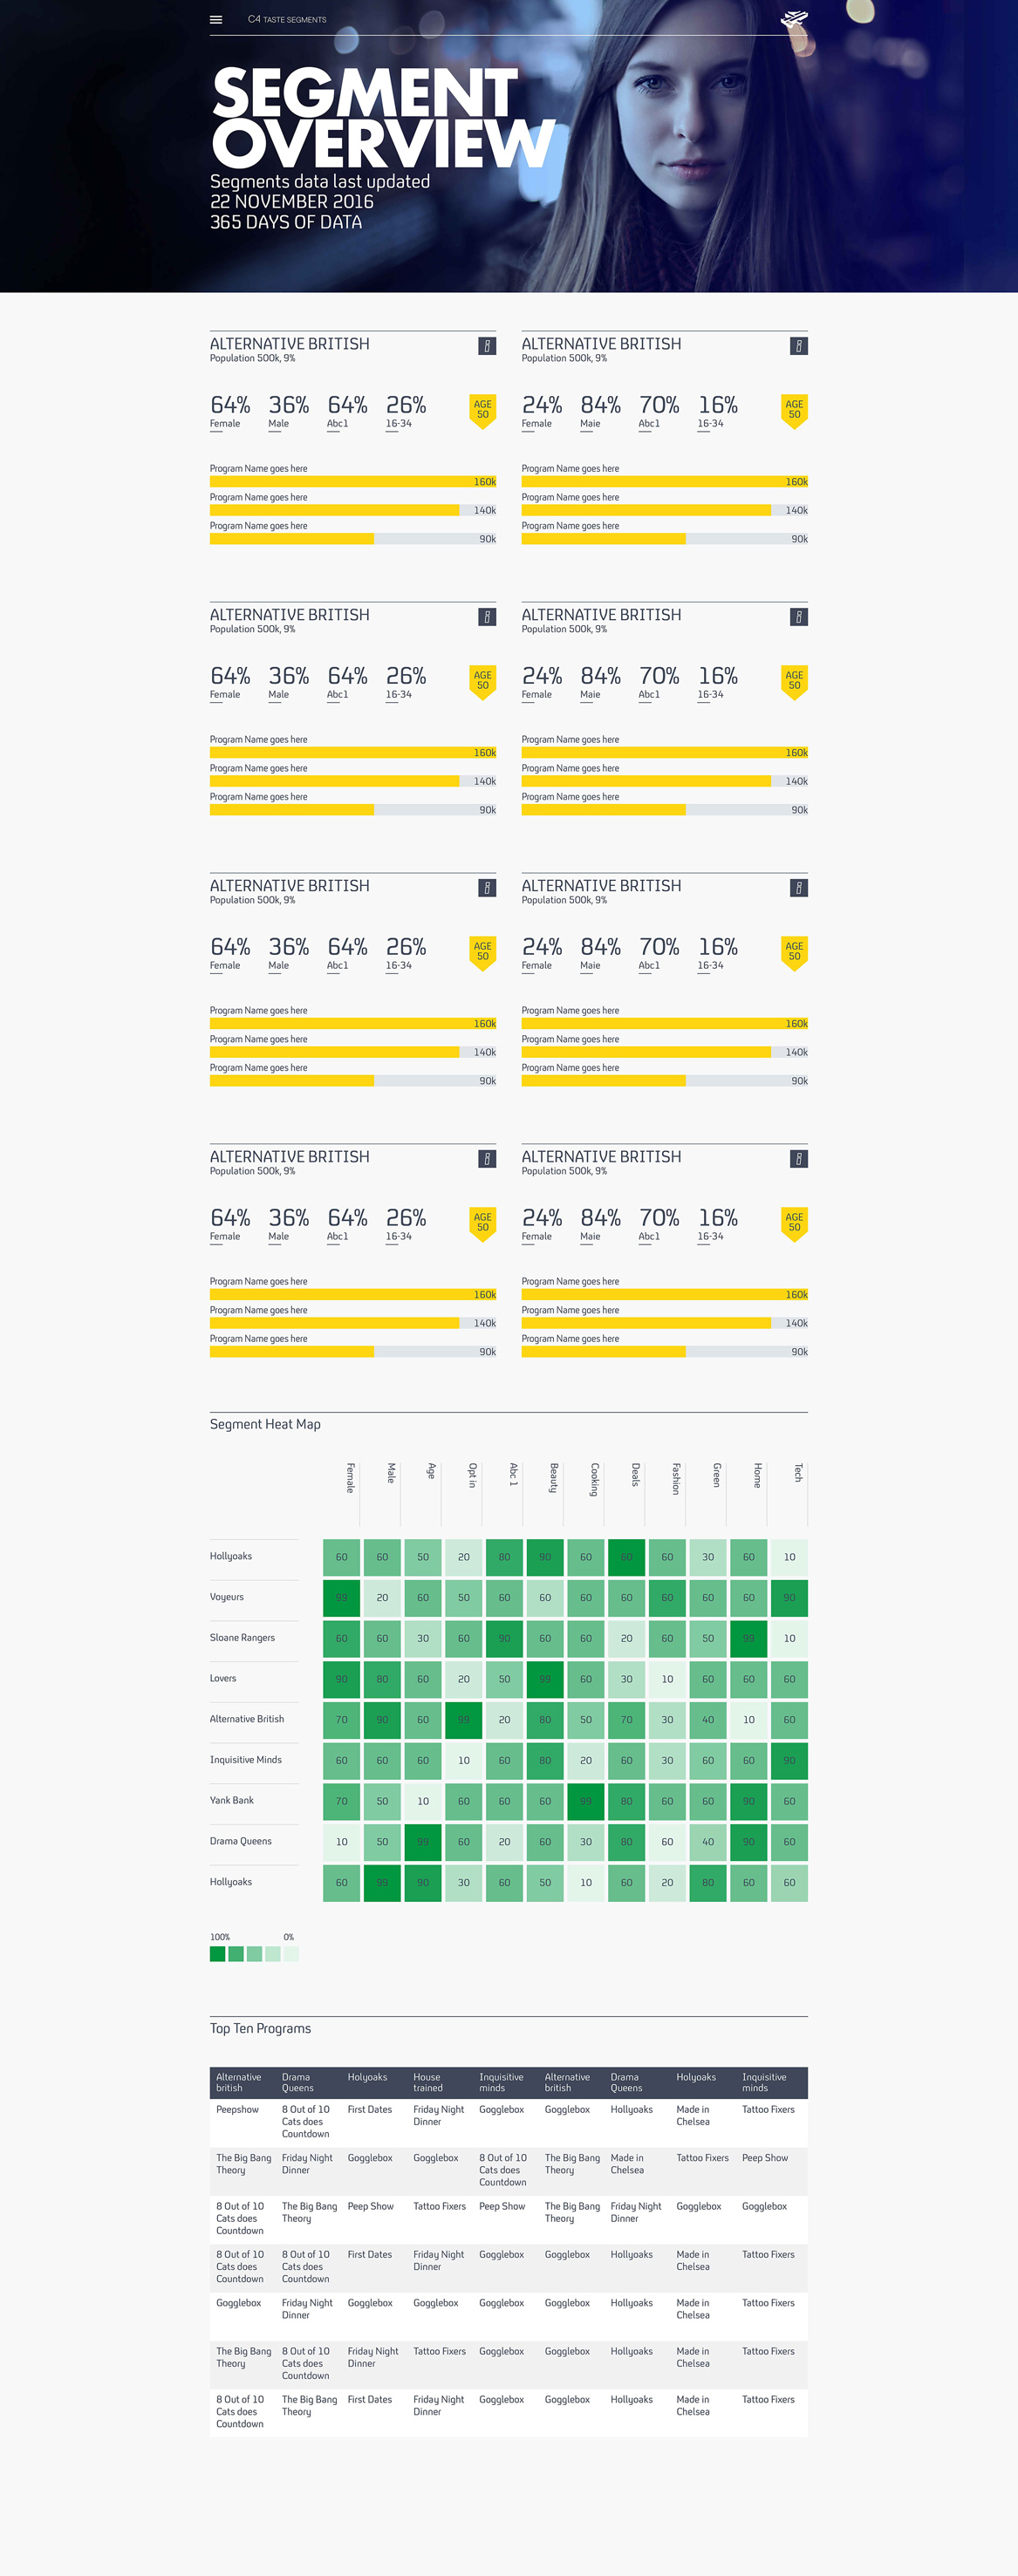
Segment_Overview
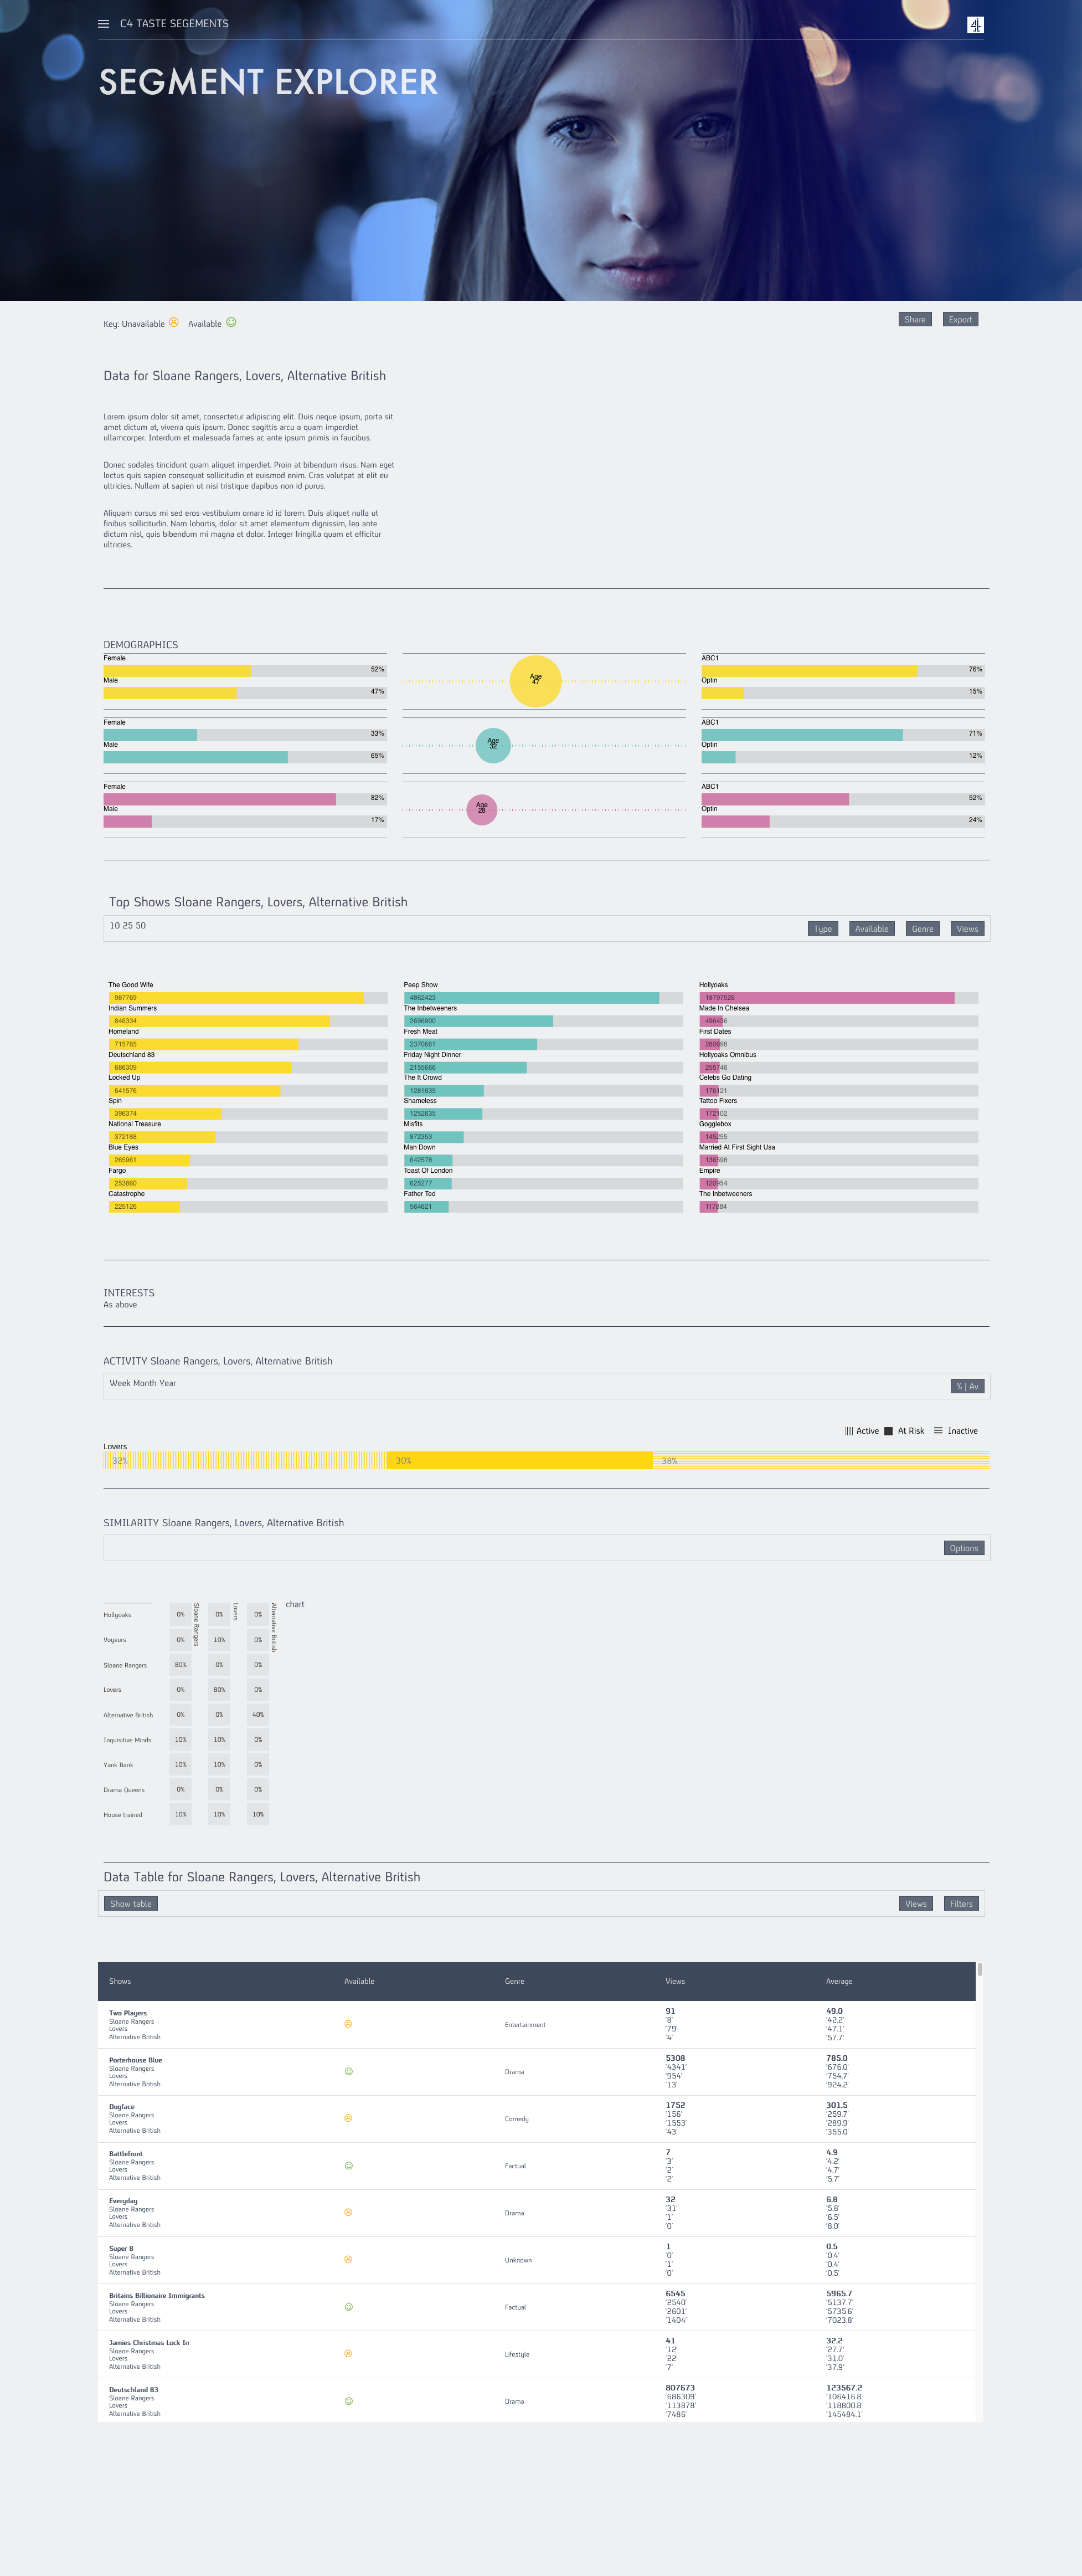
Segment_Explorer

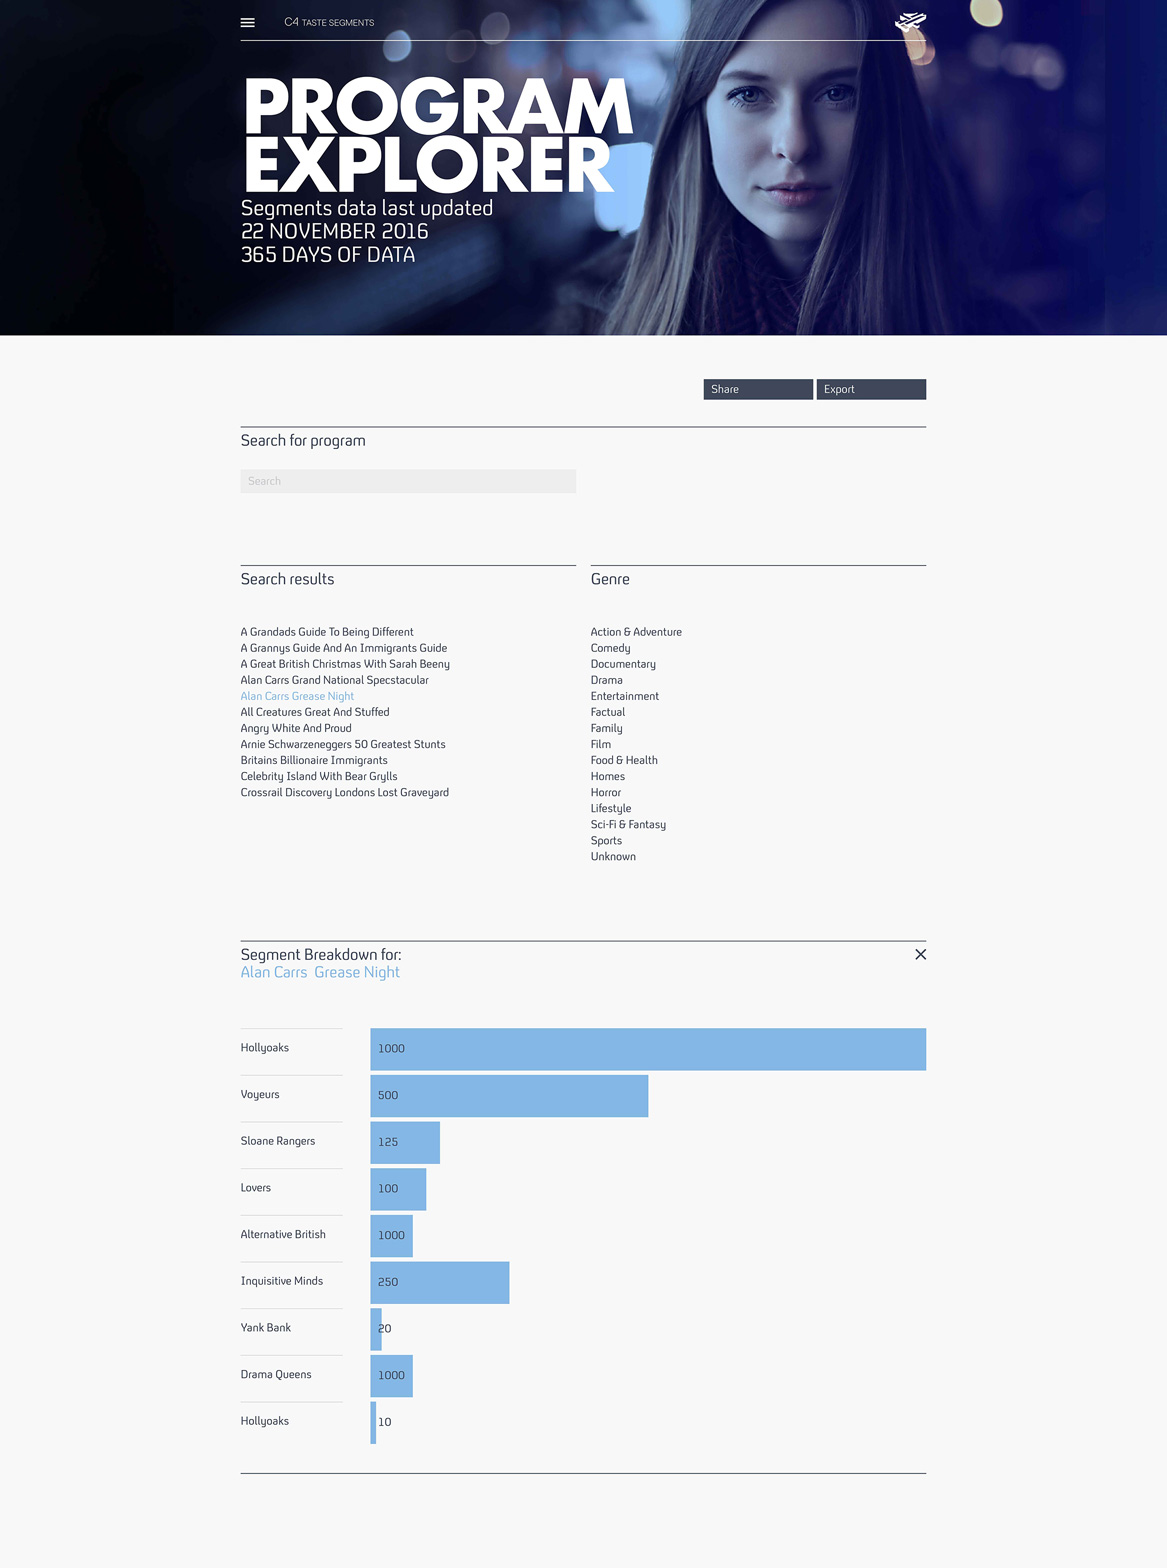
Program_Explorer
Leave a Reply