
BT
Victoria Gibson: Head of Simplify UX Chapter
TCS
James Sinclair: Senior Consultant
Virtusa
Regina Viveiros: UX Lead
My Role
My role was to raise the level and standardise the research practice within BT’s Simplify UX chapter.
Background
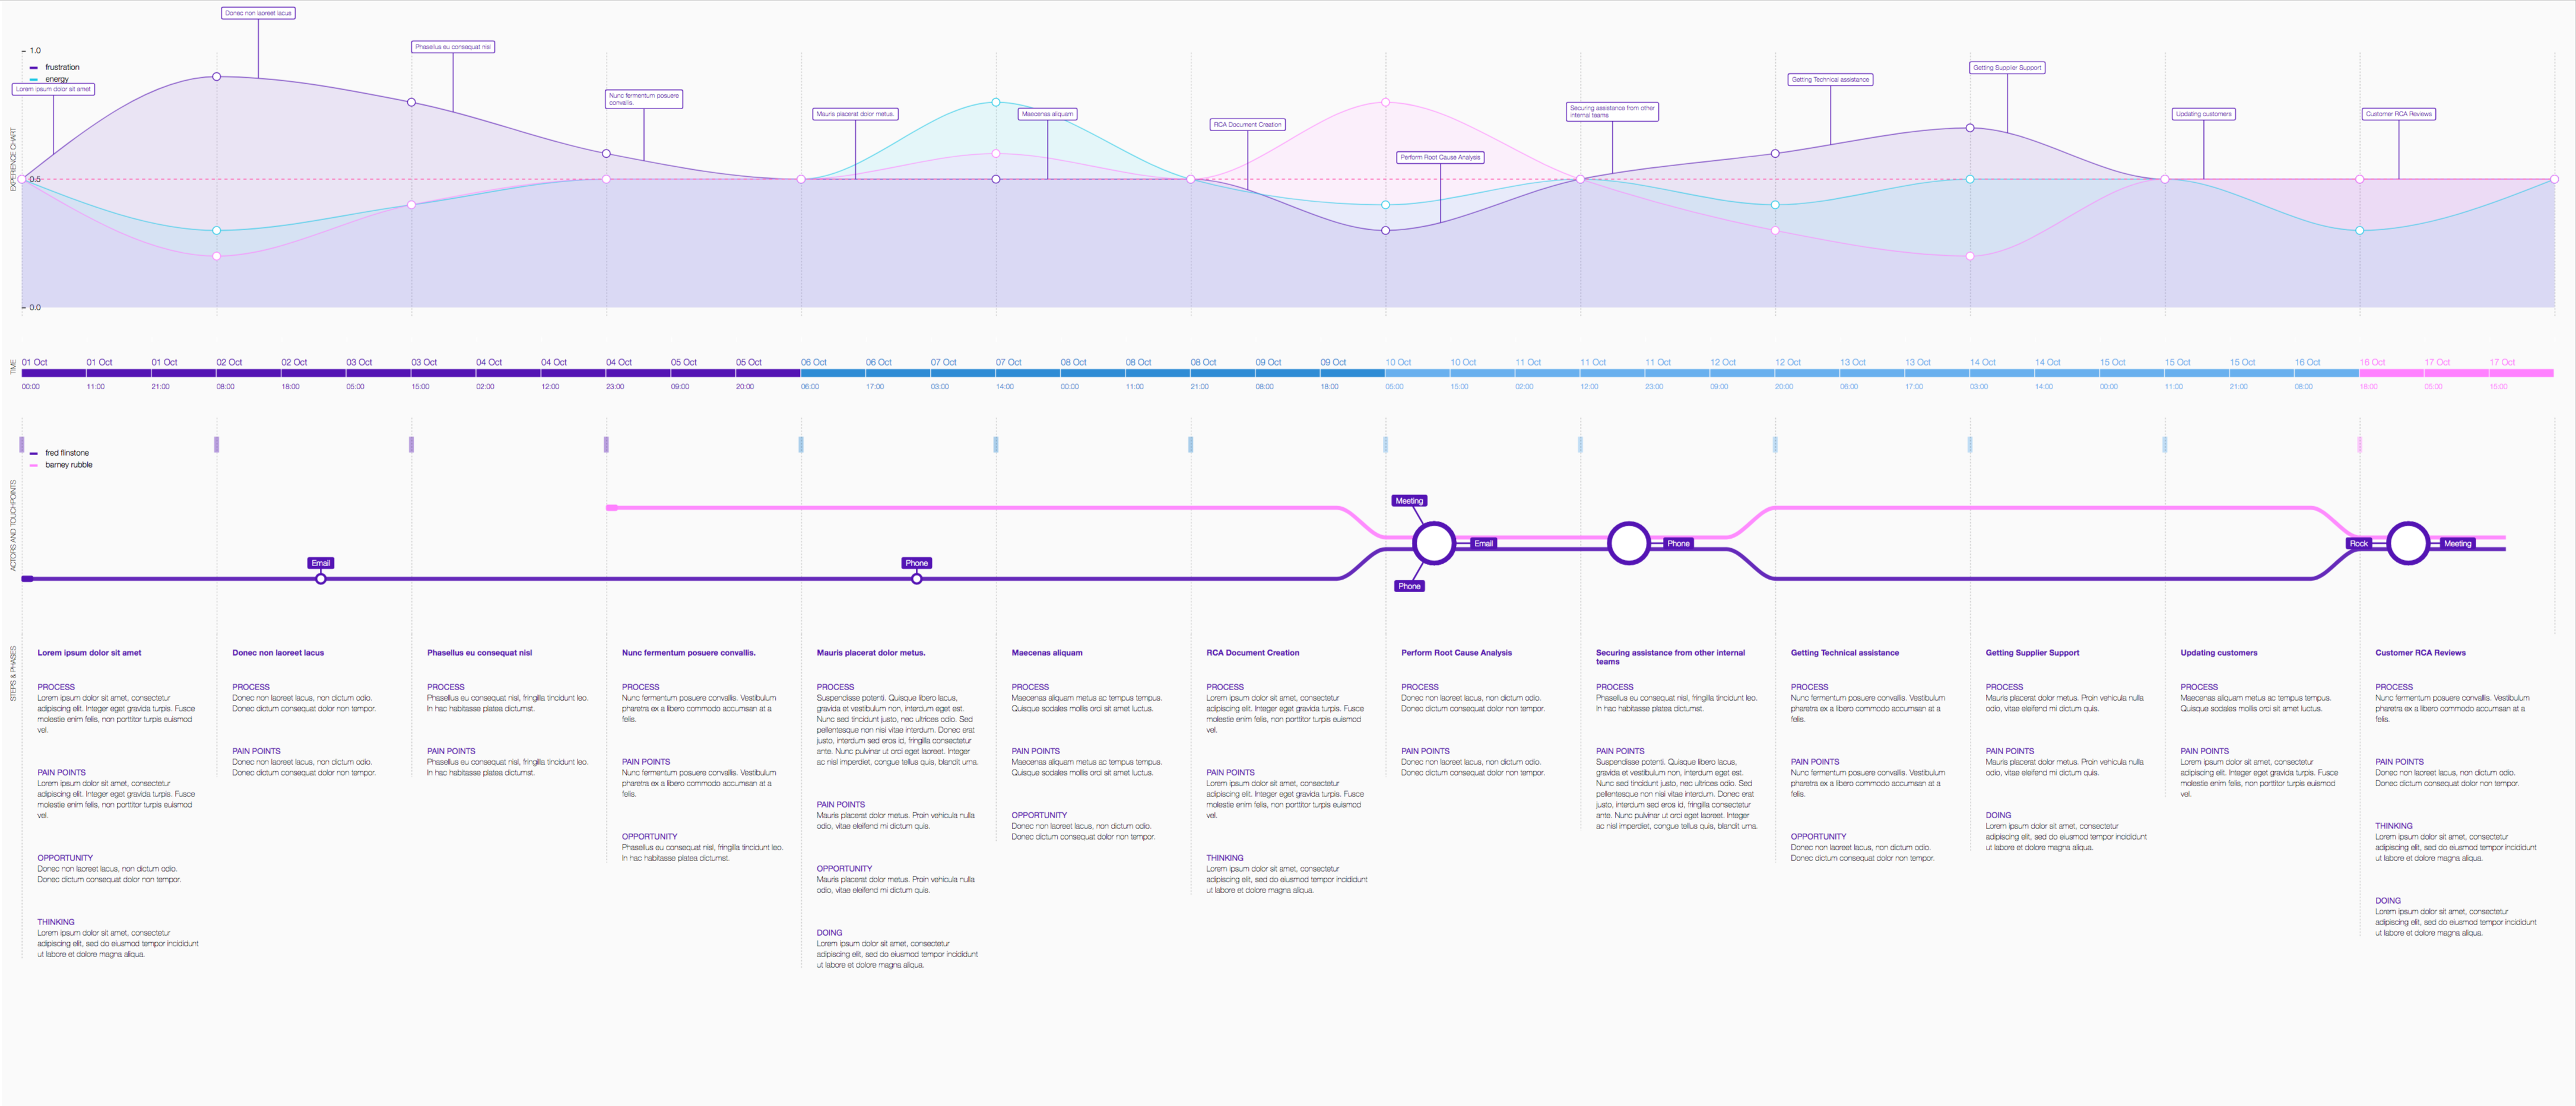
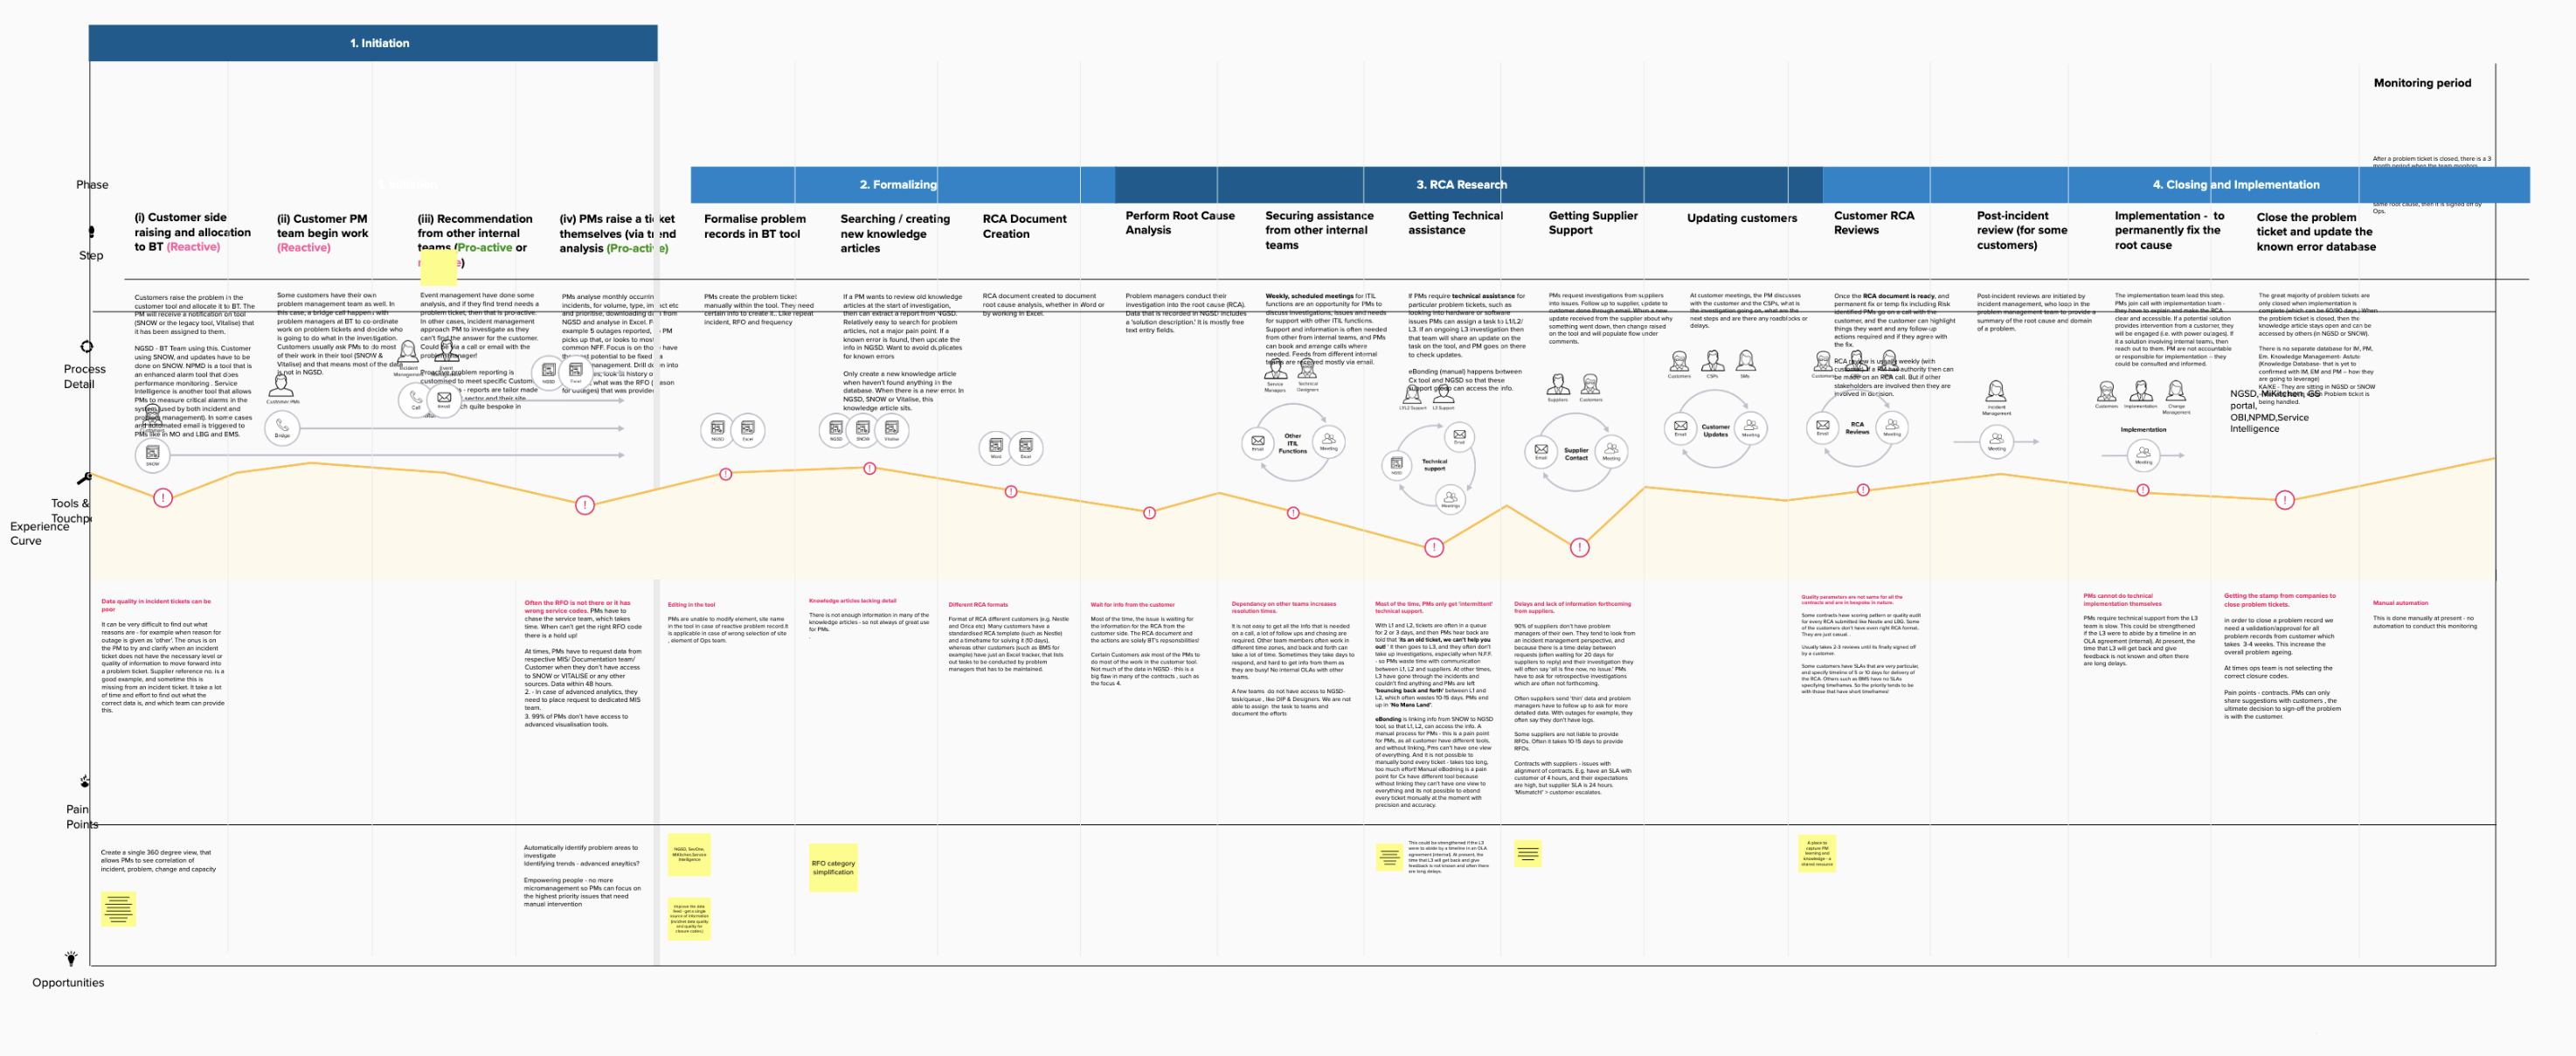
The Simplify UX team produces experience maps from interview data as a part of their workflow. These maps not only define what is happening but also help UX designers make sense of the data.
Challenges
I faced several challenges while standardising the research practice:
- Creating a standard across a group of practitioners with different approaches and skill sets
- Working in Mural, which is a key part of BT’s setup and workflow
- Respecting BT’s security requirements
- Making the process easier and quicker
- Getting UX leads to adopt a different way of working
Approach
- Investigated how the leads were working and identified the constraints of Mural.
- Recreated one of the team’s comprehensive maps within the constraints of Mural, but found it time-consuming and the final visualization was not pixel-perfect.
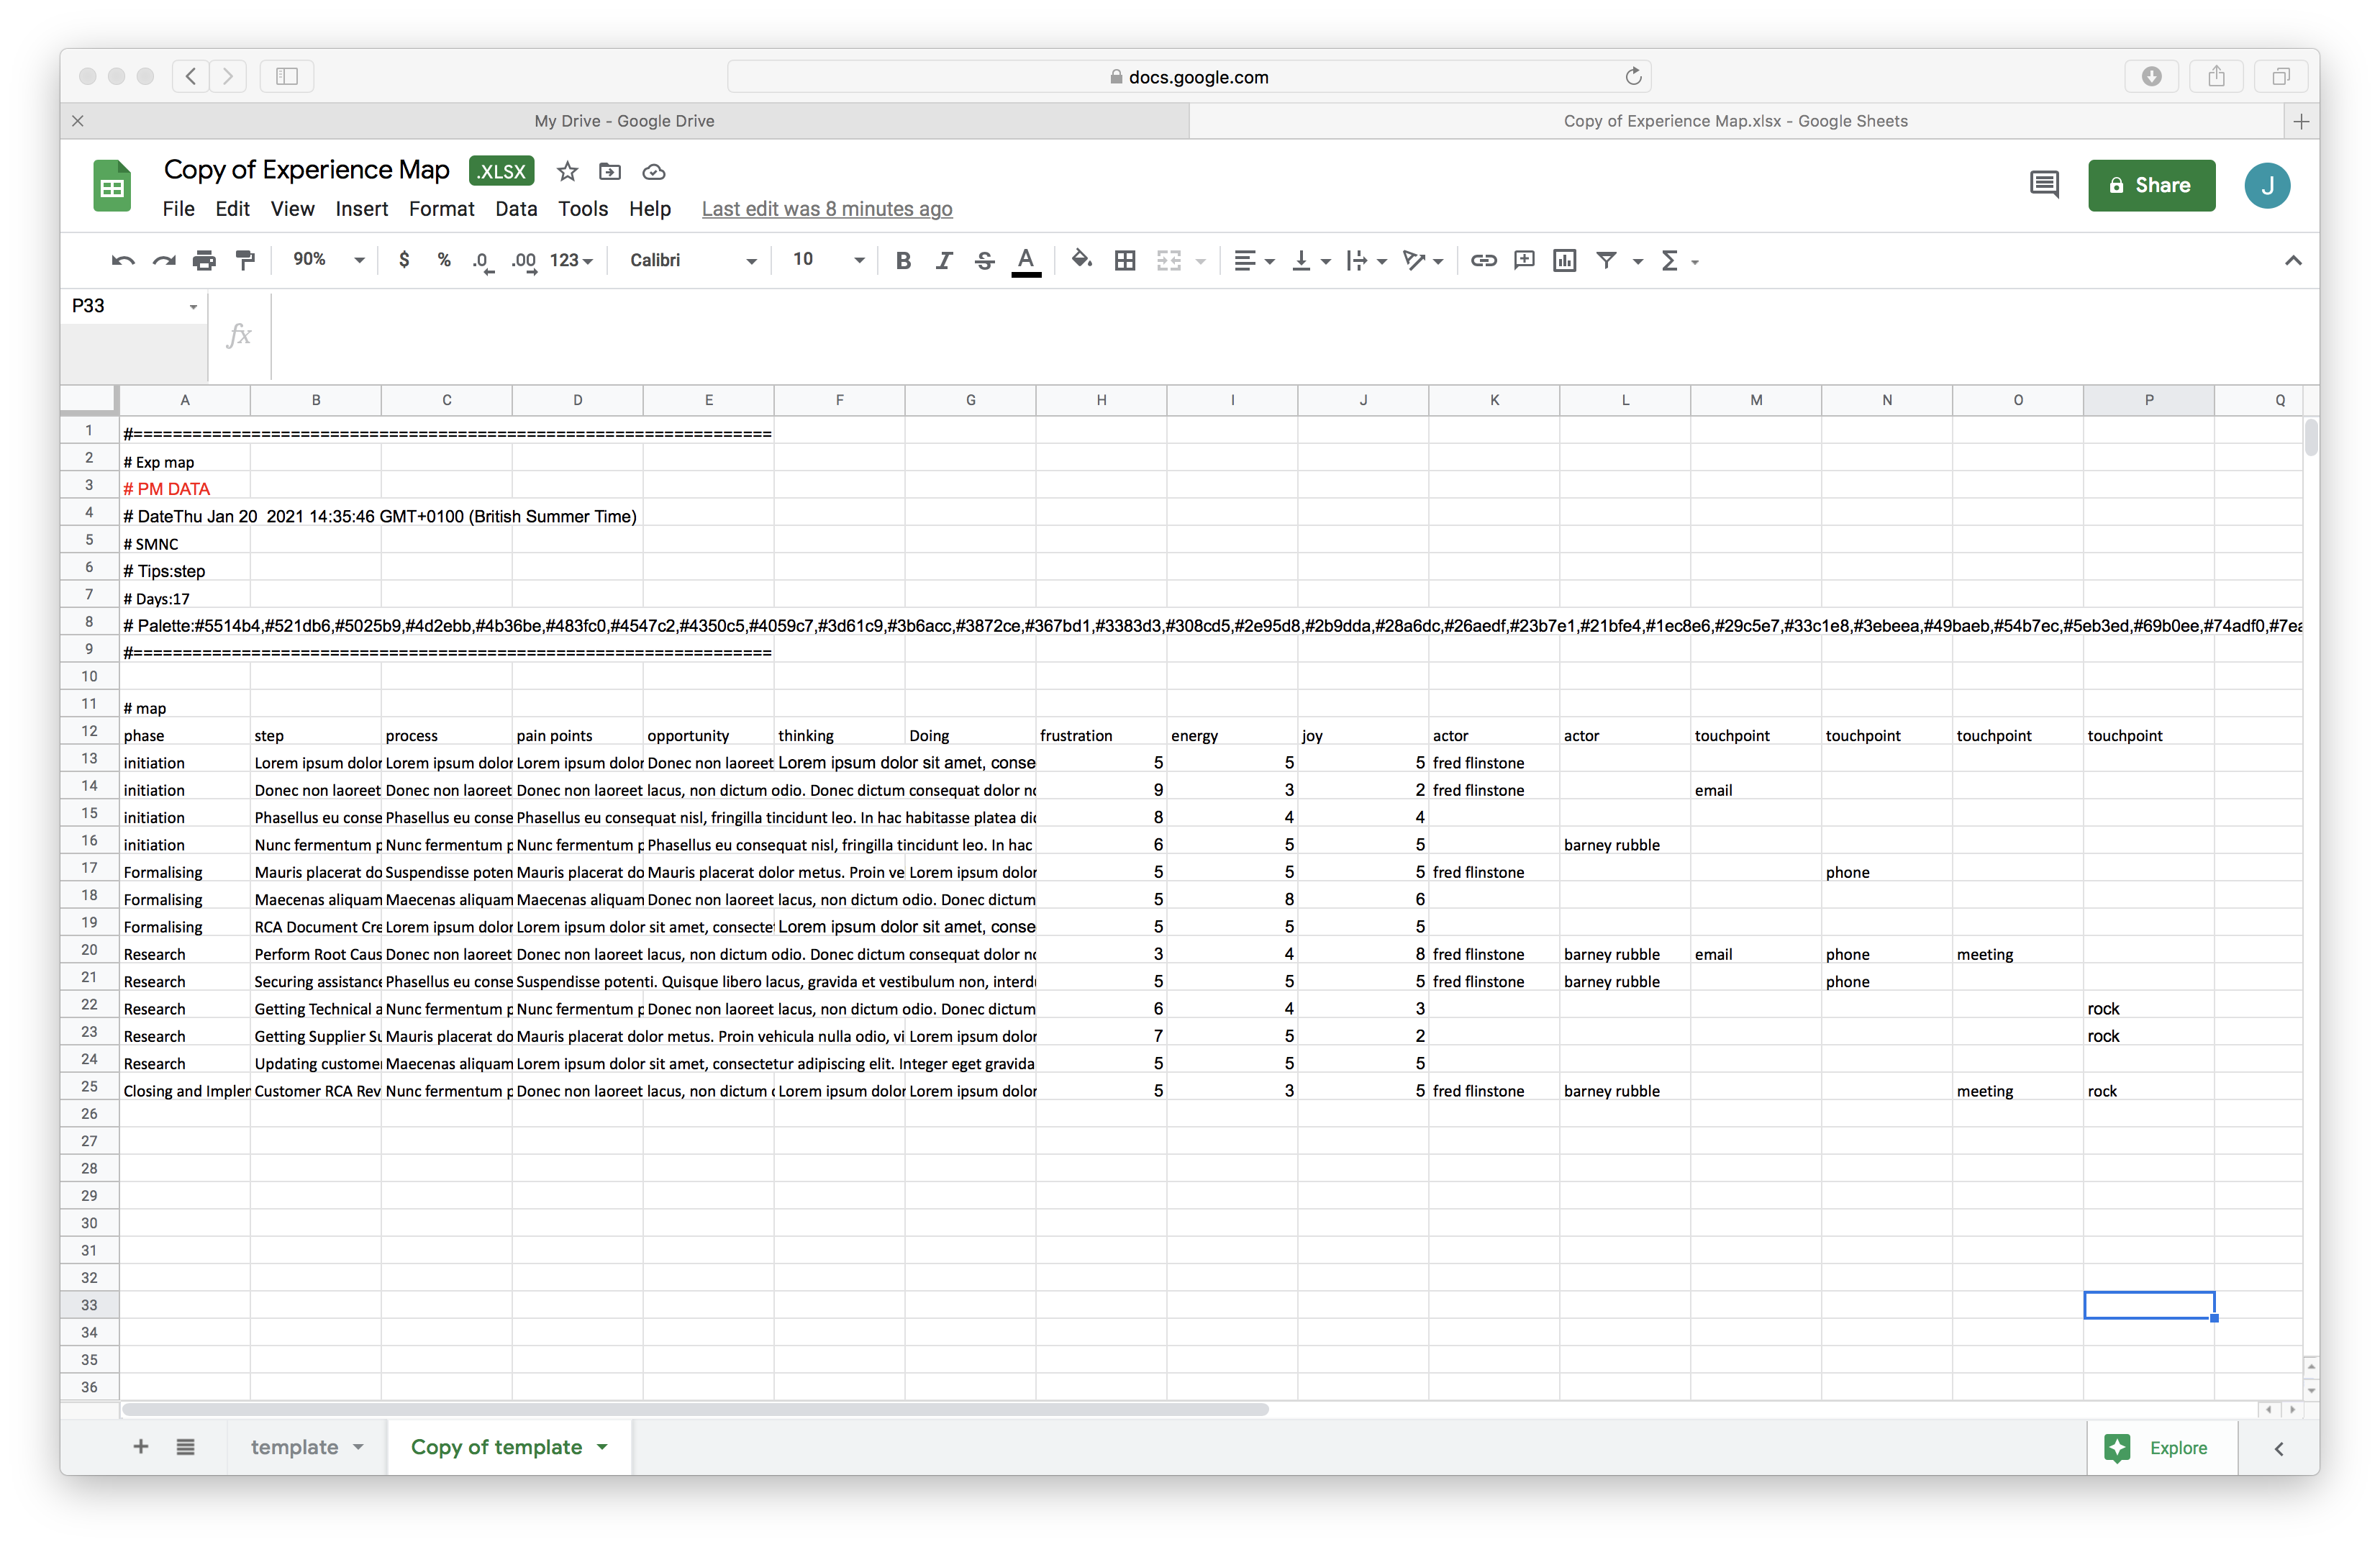
- Adopted a different strategy of taking the data and using it to generate the visualization.
- Created a data template for the visualization.
- Developed a proof of concept (POC) and demonstrated it to the team, which received a mixed reaction.
- Addressed feedback and concerns, including from a lead designer who eventually found the tool to be a huge time-saver and easy to use in working sessions.
- Fixed bugs and implemented additional requirements uncovered during the testing phase.
Regina, a lead designer was the most vocal when expressing concerns, but surprisingly, a week later, she tried the beta version for squad work.
“This tool has allowed me to generate experience maps at great speed allowing me to illustrate the customer pain points to the squad, in a story-telling format which makes it easy to understand and visually impactful. The team were impressed with how quick it was to generate these visuals which gave a clear indication of where in the customer journey we need to focus our attention. It’s a huge time saver and the Excel format is easy enough to use during working sessions with subject matter experts where we can co-create these journey maps and fits perfectly with our Agile way of working.” – Regina Viveiros, Lead UX, Virtusa
Outcome
- Putting the development data into a spreadsheet takes five to ten minutes.
- Creating the Mural visualization took two hours.
- Conservatively, it transforms an hour of work into five minutes, an 87.5% reduction in time spent.
- Outputting pixel-perfect and standardized visualizations independent of ability and experience.
- Removing low-value work from the workflow and finding more time for high-value work such as problem-solving.
Experience Map
And data template
data
Experience-Map
Previously
A selection of experience maps being created by designers within BT prior to the tool.
exp5

exp4
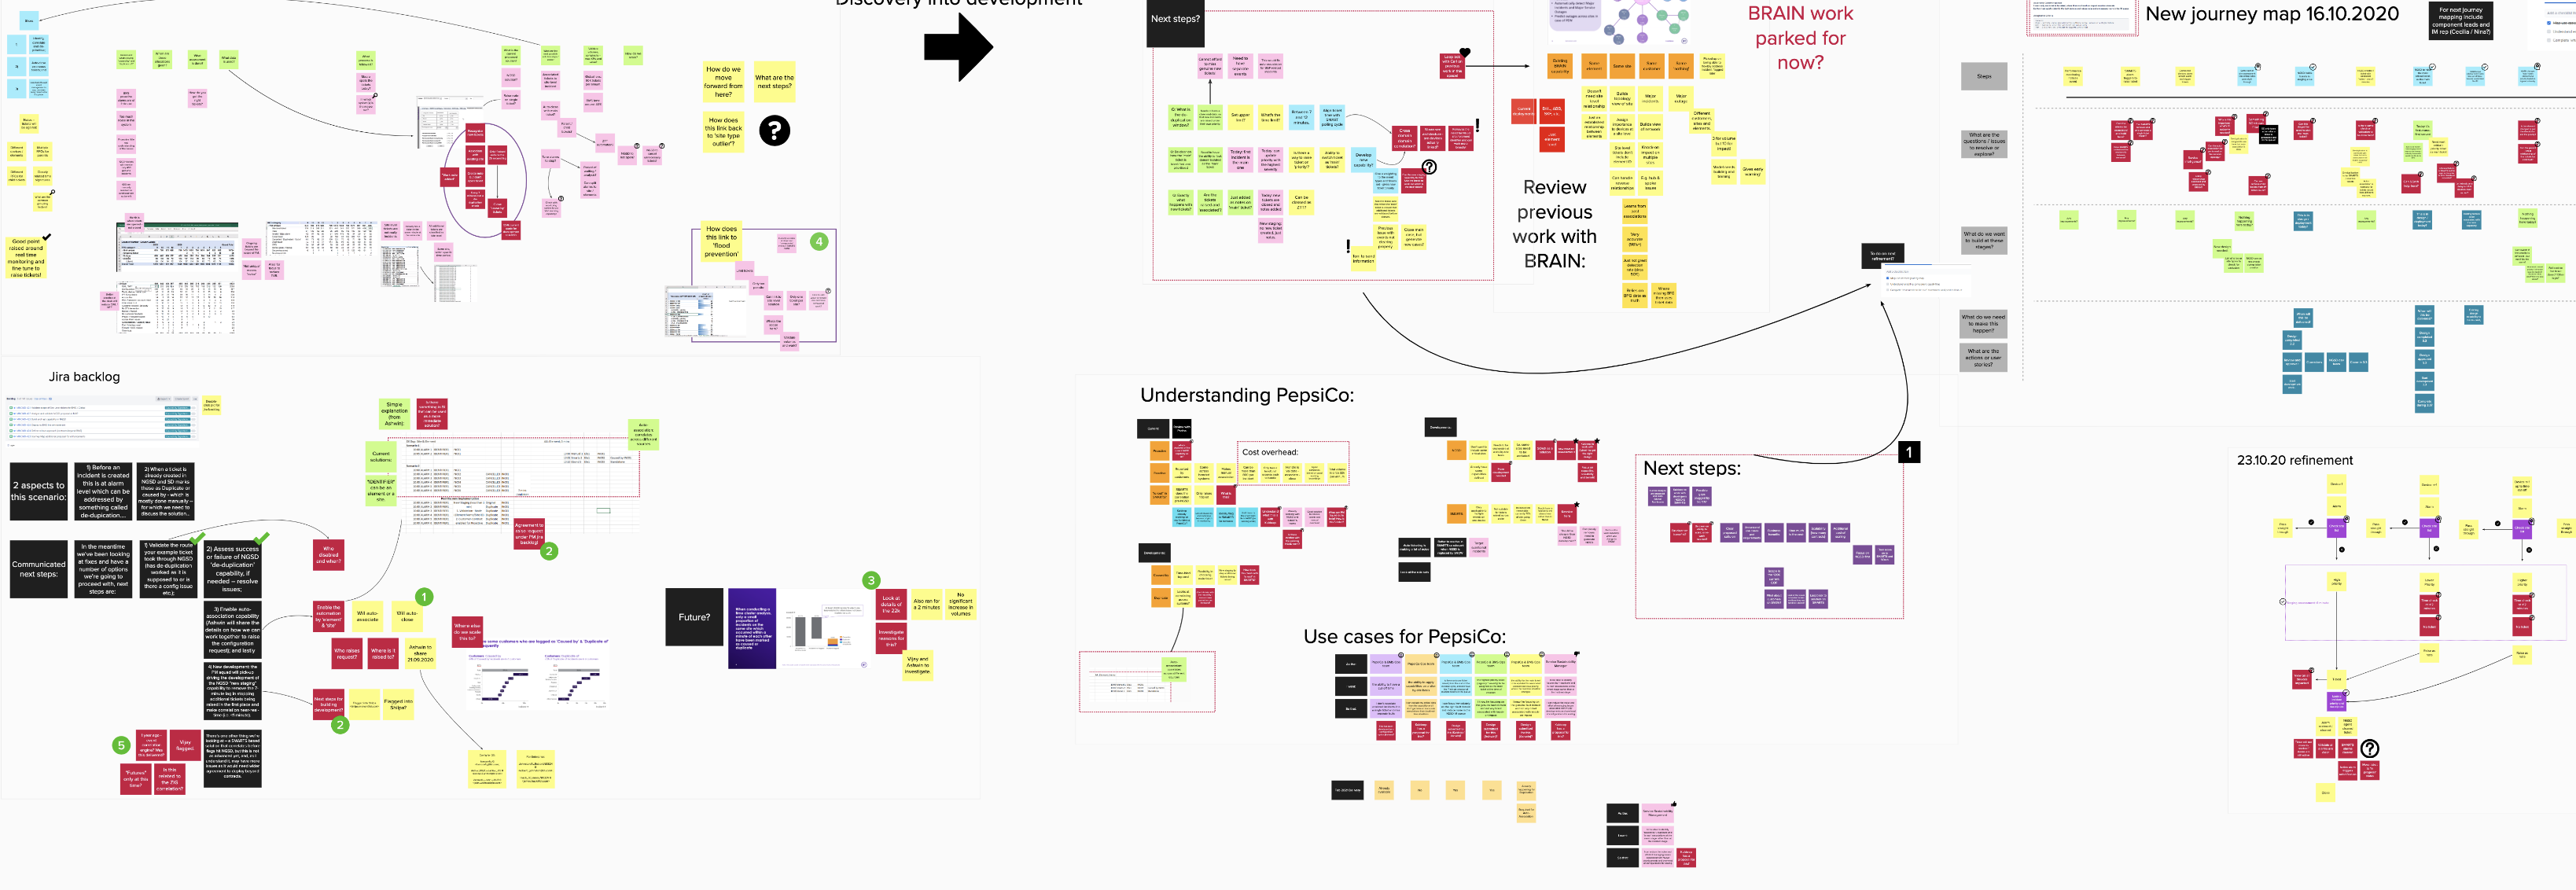
exp3
exp1
Demo
Download the data template from Google Drive as a tsv (tab separated values) and drop it on to the Experience Map.